From Footage to Findings
Traffic & Mobility
How we use AI based vehicle detection and YOLO models to make our traffic studies sharper, clearer and more reliable.
That is why we have changed the way we count. Alongside the traditional manual survey, our team now runs a vehicle detection system built on the YOLO family of computer vision models. It watches the same road our surveyors watch, and it identifies and counts every car, two wheeler, bus and truck that passes. The result is traffic data we can stand behind, and that anyone reviewing our work can check for themselves.
The count is the foundation
A traffic impact assessment is really a chain of calculations. We measure the traffic that uses a road today, convert a mixed stream of vehicles into a single common unit, work out how busy each road already is, project how busy it will become over the years ahead, add the trips a new development will generate and then judge whether the surrounding roads can carry all of it comfortably.
Every one of those steps inherits its accuracy from the very first number, the field count. A small error at the start grows quietly through the whole study. So rather than treat the count as a routine formality, we treat it as the single most important measurement in the entire report.
Why we brought computer vision to the roadside
The classified volume count, where trained surveyors stand at the kerb and tally vehicles by type, is the accepted method and we still use it. But anyone who has done it knows its honest limits. A busy junction can send a dense and fast stream of mixed traffic past a single person. Concentration drifts over a long survey day. Light fades in the evening. Two quick two wheelers can slip past as one.
So instead of replacing the manual survey, we set out to strengthen it. We record video at each survey location and let the detection model count the same traffic, frame by frame, without tiring. The two counts then sit side by side. When they agree, we have strong confidence in the data. When they differ, we know exactly where to look.
How YOLO reads a road
YOLO, short for You Only Look Once, is a deep learning model built to find and label objects in an image in a single pass. We run it in Python using widely used open libraries, with OpenCV handling the video and a YOLO framework carrying out the detection.
The model divides each video frame into a grid and, for every part of the frame, predicts whether a vehicle is present, where it sits and how sure it is. Each detection is described by a small set of values.
B = ( x, y, w, h, c ) x, y centre of the box · w, h its width and height · c the confidence score
Here x and y mark the centre of the box drawn around the vehicle, w and h give its width and height, and c is the confidence score, a number that tells us how certain the model is about the detection. We keep only the detections the model is genuinely confident about, which keeps stray readings out of the final count.
From a box to a count
Spotting a vehicle is only half the job. A car sitting in view for a couple of seconds appears in many frames, and it must not be counted many times over. So the system gives every vehicle its own identity and follows it as it moves across the screen. This step, known as tracking, is what turns a stream of raw detections into a real count.
To measure volume and direction, we draw a virtual counting line across the road inside the video. A vehicle is counted once, at the moment its tracked path crosses that line. Movement in each direction is tallied separately, so we capture not only how many vehicles use a road but which way they are heading.
Once we have counts over a known stretch of time, turning them into an hourly flow is straightforward.
Qk = ( Nk ÷ t ) × 3600 Q hourly flow, vehicles per hour · N vehicles detected of class k · t observation time in seconds
OIn this expression Q is the hourly flow for a class of vehicle such as cars or buses, N is the number of those vehicles detected, and t is the length of the observation in seconds. Applied to each direction and each vehicle type, the same simple method gives us a complete hourly picture of the road.
Tested in daylight and after dark
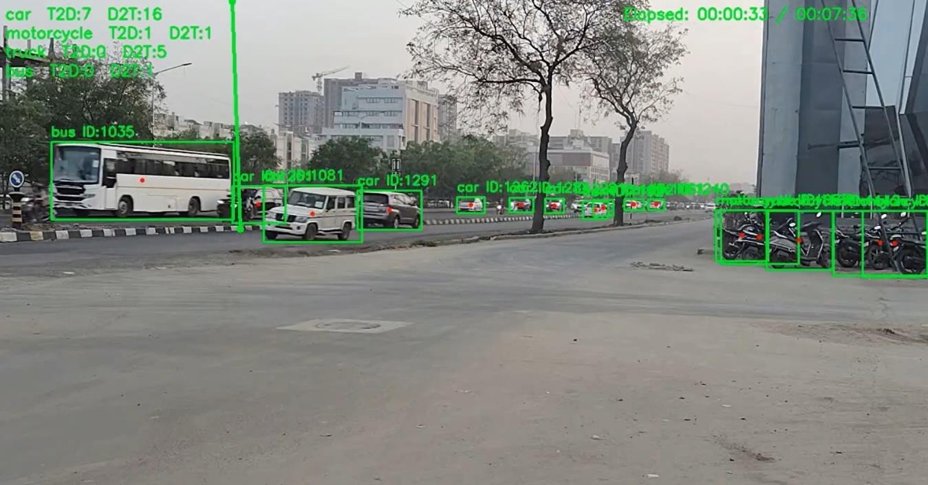
Field conditions are never ideal, and a method only earns its place if it holds up in them. The frame at the top of this article was captured in clear daylight, when detection is at its easiest. The real test comes after sunset, when headlights, shadows and glare make counting hardest.
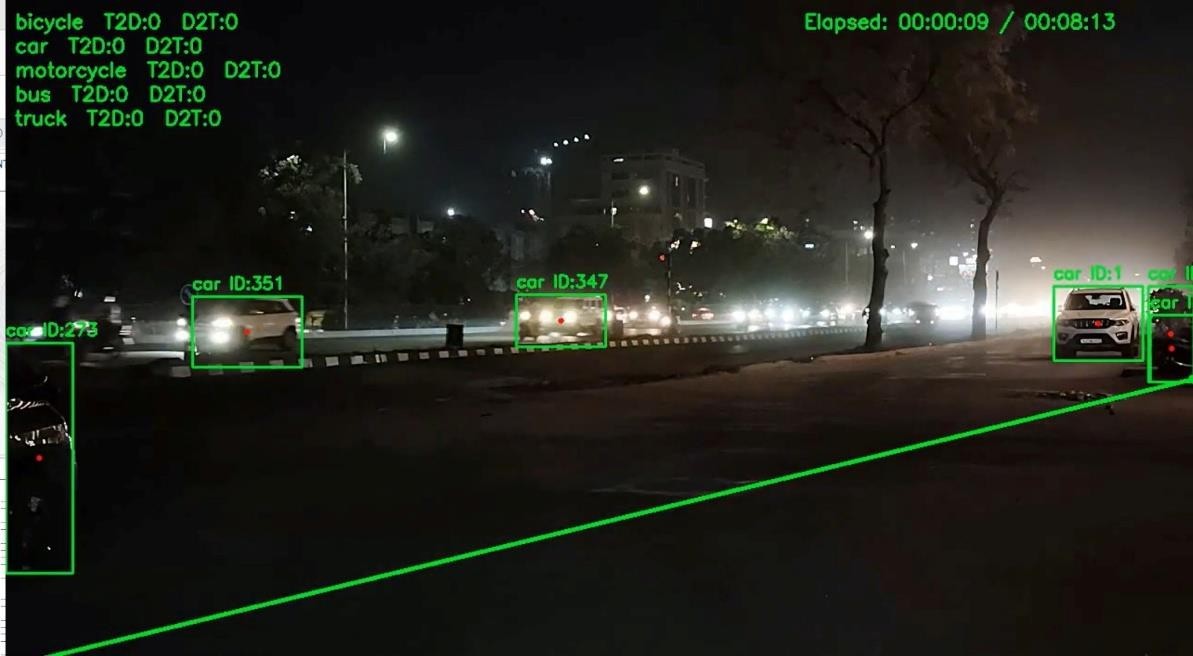
Watching the system keep detecting, labelling and tracking vehicles under low light is what gives us the confidence to rely on it across the full survey window, not only the easy daytime hours.
From a clean count to an engineering answer
With a dependable count in hand, the rest follows established practice. We convert the mixed traffic into Passenger Car Units, so that a motorcycle, a car and a truck can be compared on a common scale, following the Indian Highway Capacity Manual and the guidance of the Indian Roads Congress. From there we work out how each road performs today, project that performance into the future and express the outcome as a Level of Service grade that planners and authorities recognise at a glance. The detection based count simply makes the foundation under all of this far more solid.
From footage to findings, step by step
Capture
Record traffic video on site
Extract
Break the video into frames
Detect
YOLO finds each vehicle
Track
Follow every vehicle by ID
Count
Tally at the counting line
Convert
Hourly flow, PCU and LOS
Why this matters for the people who read our reports
For a developer, an approving authority or a review committee, the value of this approach comes down to four things.
Quality
The count is built from thousands of individual detections across the full survey, not from one pair of eyes on a busy day.
Accuracy
Two independent methods, the human survey and the machine, confirm the same numbers before anything is reported.
Transparency
Because the survey is recorded, the footage and the detection output can be revisited at any time. A figure in our report is something you can actually see, not simply take on trust.
Reliability
The method behaves consistently across locations, vehicle types and lighting, and it does not lose focus as the hours go by.
Measurement you can see
Good traffic planning begins with honest measurement. By bringing vehicle detection to the roadside, we have turned our first and most important number into something we can defend with confidence and show openly. The technology is genuinely useful, but the real point is simpler. It lets us hand over a study that is accurate, clear and built to stand up to scrutiny.
Planning a development and want a traffic impact assessment grounded in evidence of this kind? We would be glad to talk it through with you.